Fuel Economy: Where the Numbers Diverge
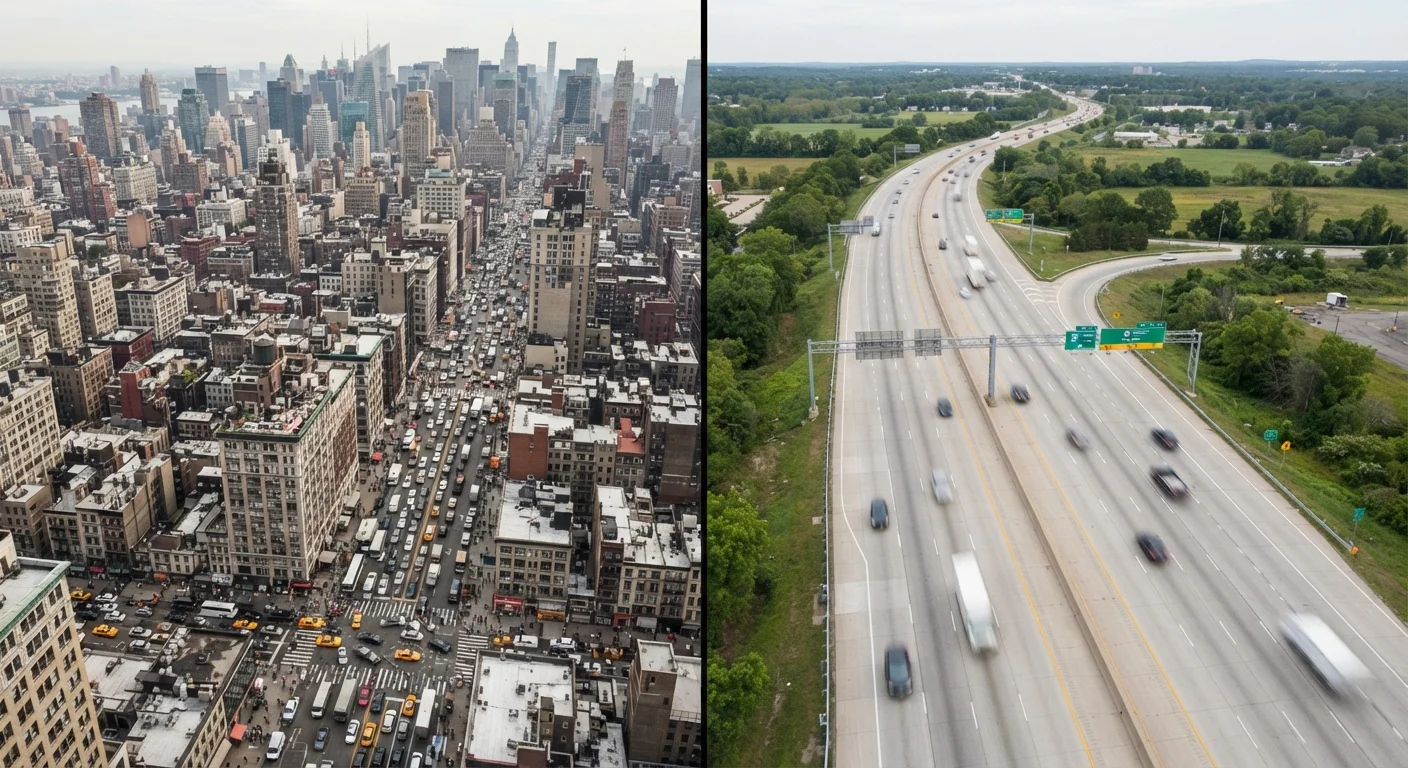
The EPA assigns every vehicle two fuel economy figures - a city rating and a highway rating - for good reason. The gap between them is often significant. A typical midsize sedan might return 28 mpg in city conditions but 38 mpg on the highway. That 10-mpg difference translates directly into dollars at the pump.
Stop-and-go traffic forces the engine through repeated acceleration-and-deceleration cycles, burning more fuel per mile than steady cruising. Highway driving at moderate speeds allows the engine to operate in a more efficient range, reducing fuel consumed per mile traveled. For a driver logging 12,000 miles annually on a 60/40 city-highway split, the fuel cost difference versus a primarily highway driver can run into hundreds of dollars per year depending on local gas prices.
See our detailed breakdown of lifetime fuel costs for a data-driven look at how those per-mile differences compound over years of ownership.
~30%
Typical city vs. highway mpg gap
EPA data consistently shows city ratings running 25-35% below highway ratings for most conventional gasoline vehicles.
2x
Brake replacement frequency in urban use
Automotive maintenance research indicates city-heavy drivers can face brake pad replacement roughly twice as often as highway-dominant drivers at equivalent mileage.
Mechanical Wear: Brakes, Tires, and Transmission
Fuel is only part of the picture. City driving imposes disproportionate mechanical wear on several key systems.
- Brakes: Frequent stops in urban traffic consume brake pad material far faster than highway driving. City-heavy drivers can expect to replace pads significantly more often - sometimes twice as frequently as highway-dominant drivers with similar total mileage.
- Tires: Repeated acceleration from stops, sharp turns, and uneven urban road surfaces accelerate tread wear. Potholes common in dense urban areas also increase the risk of sidewall damage and alignment problems.
- Transmission: Automatic transmissions shift more frequently in stop-and-go conditions, generating additional heat and stress. Over time this can shorten fluid life and component longevity.
- Engine idling: Extended idling at traffic lights adds engine hours without adding mileage, skewing the relationship between odometer reading and actual engine wear.
Highway driving isn't wear-free - sustained high speeds increase aerodynamic load and tire heat - but the per-mile mechanical toll is generally lower. Your specific driving habits shape these costs more than most drivers realize.
| Cost Factor | City Driving | Highway Driving | |
|---|---|---|---|
| Fuel efficiency | Lower mpg, higher cost per mile | Higher mpg, lower cost per mile | |
| Brake wear | Accelerated - frequent stops | Minimal - steady speeds | |
| Tire wear | Higher - road hazards, acceleration | Moderate - heat and speed factors | |
| Insurance premiums | Generally higher - density and theft | Generally lower - fewer urban risks | |
| Engine/transmission stress | Higher - idling and frequent shifts | Lower - sustained cruising range | |
| Annual mileage typical | Often lower but costlier per mile | Often higher but cheaper per mile |
Insurance Costs: Location and Risk Profile
Where you drive influences what you pay for insurance, sometimes dramatically. Insurers price risk based on accident frequency, theft rates, vandalism exposure, and population density - all of which skew higher in urban environments.
City drivers commonly face higher comprehensive and collision premiums because denser traffic increases the statistical likelihood of an at-fault or not-at-fault accident. Parking on city streets also raises exposure to theft and minor collision damage. Rural and suburban highway-dominant drivers typically see lower base rates, though longer commute distances can partially offset that advantage.
Ask About Usage-Based Insurance
If you drive relatively few miles per year primarily in urban areas, a usage-based or pay-per-mile insurance program may reflect your actual risk more accurately than a standard annual premium. These programs typically use a telematics device or app to track mileage and driving behavior. Compare quotes carefully and read the terms - some programs also factor in hard-braking events, which are more common in city conditions.
Your ZIP code is one of the most influential variables in your premium calculation. Moving even a few miles from a dense urban core to a suburban area can produce a measurable rate difference with the same vehicle and driving record. For a fuller picture of what drives your rate, see our guide on why car insurance costs vary so much.
Putting It All Together: Your True Cost Profile
Ownership costs don't exist in isolation. Fuel, maintenance, and insurance interact - and your city-versus-highway driving mix shapes all three simultaneously. A driver who logs only 8,000 miles per year but does so entirely in dense urban traffic may spend more on brakes, fuel, and insurance than a driver covering 14,000 miles predominantly on the highway.
To build an accurate cost picture, consider tracking your actual route split over a month. Most modern vehicles with trip computers can provide city versus highway data, and some insurance telematics programs also capture this. Use that information to calibrate your maintenance budget and understand where your biggest cost exposure lies.
For broader context on how these per-mile costs roll into the full picture of ownership, our article on the true cost of owning a car in the US breaks down every major expense category. And if you're deciding between vehicle types, our comparison of gas vs. electric long-term ownership costs is worth reviewing - city driving, in particular, is where electric vehicles tend to show the greatest efficiency advantage over gasoline engines.